Shoreline Erosion Prediction
Abstract
Abstract
Aim:
Identifying the shoreline region and developing models to predict future shoreline curves.
Proposed Solution:
The initial step involves selecting the study area, followed by conducting analysis through graph plotting. The chosen stretch spans from Sashithlu Beach to Surathkal, encompassing approximately 9.8 kilometers of shoreline, which includes:
1. Sashithu Beach
2. Mukka Beach
3. NITK beach
4. Surathkal Beach
Data Acquisition: Satellite imagery sourced from Google Earth Pro facilitated detailed visuals of the study area across various time frames. These images were georeferenced and imported into ArcGIS for further analysis.
Data Preprocessing:
Cannys Edge Detection:
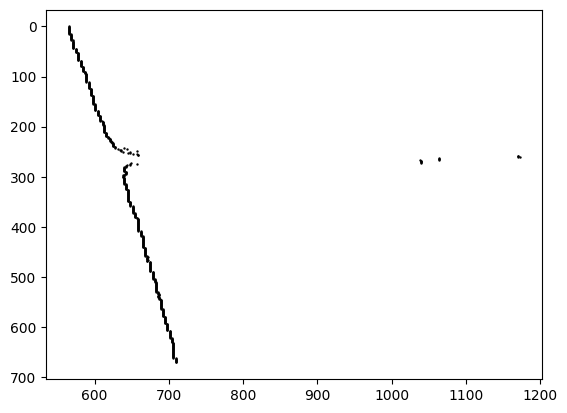
To select and identify the shoreline in the images, we utilize the concept of rate of color change. Canny's edge detection algorithm is one such method that leverages this concept to identify edges, which, in our case, represent the shoreline curve. Subsequently, we generate a dataframe where the columns represent the axis and the years (ranging from 1984 to 2022), with the axis denoting the horizontal segment.
 Duplicates Removal:
In the provided Canny edge detection plot above, it's evident that there are multiple points for a particular horizontal segment. However, our shoreline corresponds to the leftmost face when approached. Therefore, apart from these initial points, all others need to be removed. This is achieved using the following code:
 After applying this processing, the resulting plot is displayed below:

Null value handling:
To handle potential null values for certain axes in our dataframe, we implement the following concept:

Model Building:
Each axis of the shoreline plot will have its own model, where the independent variable in each model will be the year, and the dependent variable will be the location of points.
For example, the plot of location of points versus the year for the first axis is as follows:

We have developed predictive models utilizing four machine learning algorithms. Below, we provide a brief overview of each:
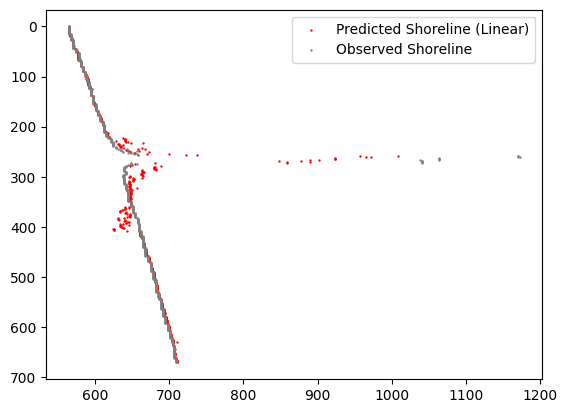
1) Linear regression:
This algorithm is one of the simplest, which is why we tackled it first. However, its accuracy is significantly low.

2) Nueral Network:
The results observed are underfit.

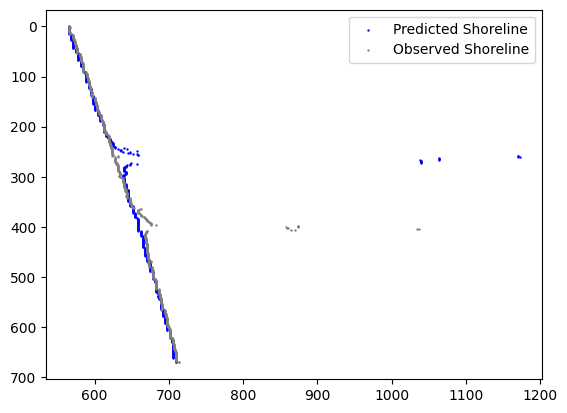
3) Decision Tree:
In this model, it's evident that overfitting occurs, meaning it performs exceptionally well on the training data but poorly on the test data.
Training data results:

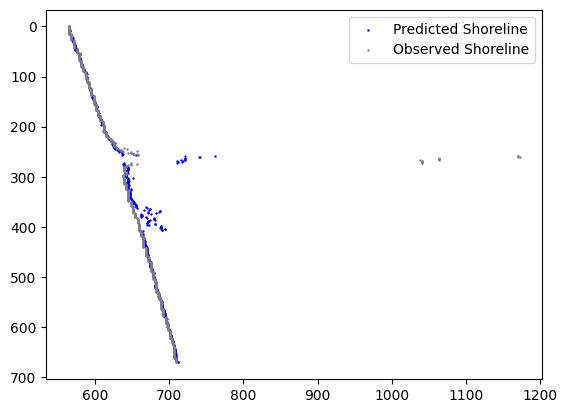
4) SVR (Support Vector regression):
The ideal model, achieving good results for both training and test data.

Conclusion:
The predictive models developed here will aid in forecasting erosion in the upcoming years. By comprehending the nature of these changes, we can gain insights into flood behavior and implement preventive measures accordingly. The outcomes of this study contribute significantly to advancing our understanding of coastal processes and facilitate informed decision-making in coastal management.
References:
2. Mapping shoreline change using machine learning: a case study from the eastern Indian coast
Report Information
Team Members
Team Members
Report Details
Created: March 21, 2024, 7:07 p.m.
Approved by: Shannon Britney Carlo [Piston]
Approval date: March 22, 2024, 4:32 p.m.
Report Details
Created: March 21, 2024, 7:07 p.m.
Approved by: Shannon Britney Carlo [Piston]
Approval date: March 22, 2024, 4:32 p.m.

